
Troubleshooting Control Plane Failure - CKA

Enthusiastic about DevOps tools like Docker, Kubernetes, Maven, Nagios, Chef, and Ansible and currently learning and gaining experience by doing some hands-on projects on these tools. Also, started learning about AWS and GCP (Cloud Computing Platforms).
This Blog focuses on common control plane failure scenarios relevant to the Certified Kubernetes Administrator (CKA) exam to understand how to troubleshoot and fix control plane issues in a Kubernetes cluster.
Scenario 1: Connection Refused to the Kubernetes API Server
Scenario: A Kubernetes cluster (one control plane node and two worker nodes) is in a broken state.
Troubleshooting Steps:
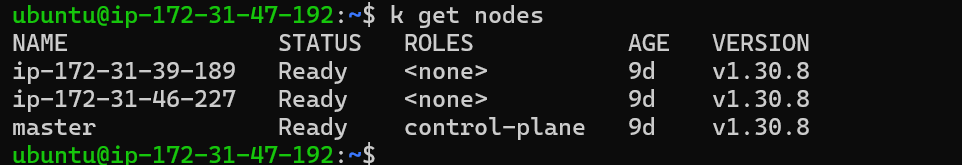
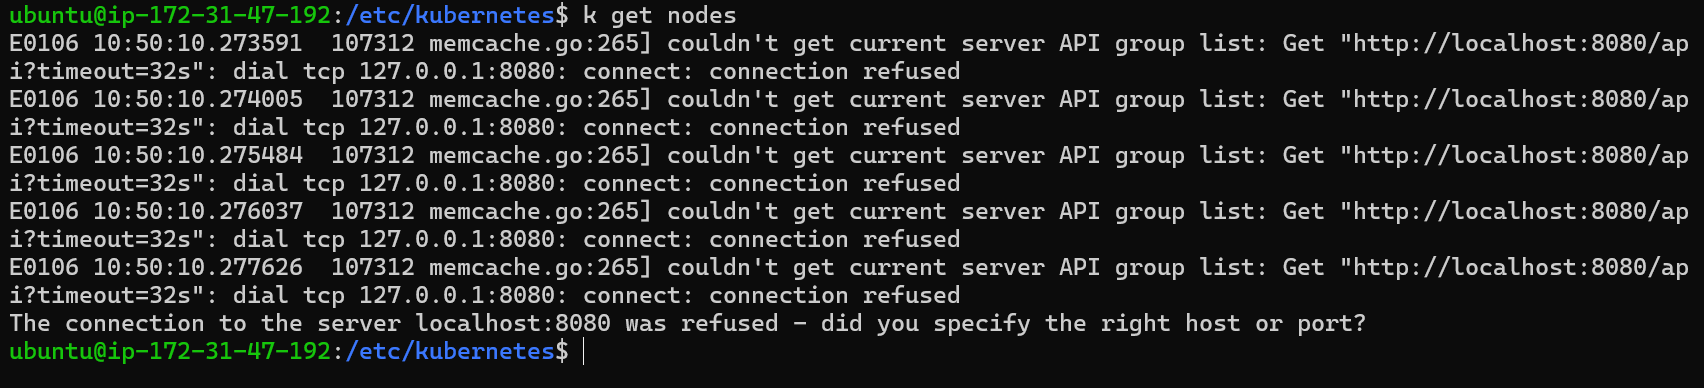
Verify Node Status: Run the command
kubectl get nodesto check the status of the nodes in the cluster.Expected out -
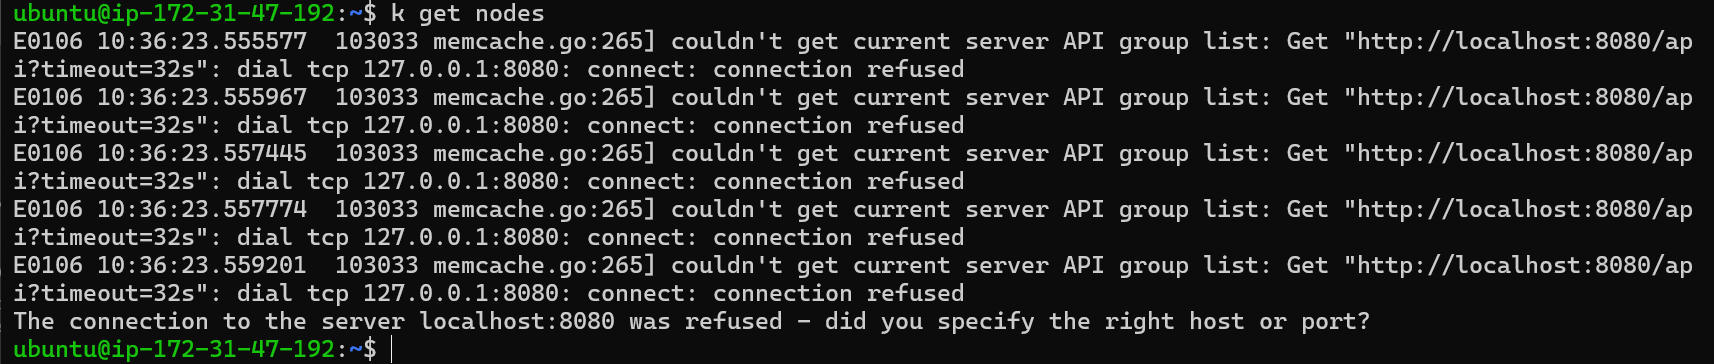
Error -

Identify the Issue: If the command returns an error indicating a connection refusal to the Kubernetes API server, it suggests a problem with the API server itself.
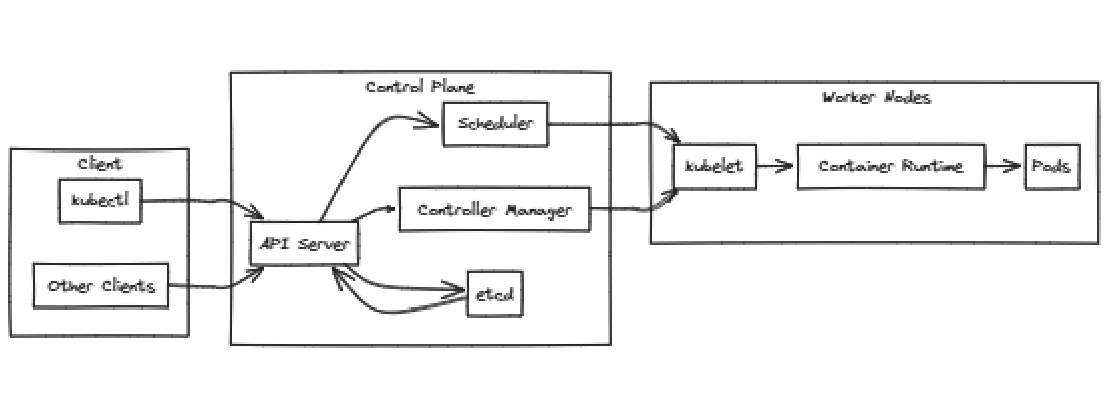
Understand the Kubernetes Architecture: Recall the Kubernetes architectural diagram, which shows the API server as the first point of contact for all client interactions.

Check API Server Process: Since the API server is a static pod running as a container, you would typically use
docker psto check if it's running. However, in Kubernetes versions 1.24 and later,containerdis the default runtime, replacing Docker.Use
crictlCommand: Use thecrictlcommand (client forcontainerd) to check running containers. The commandcrictl pswill list running containers.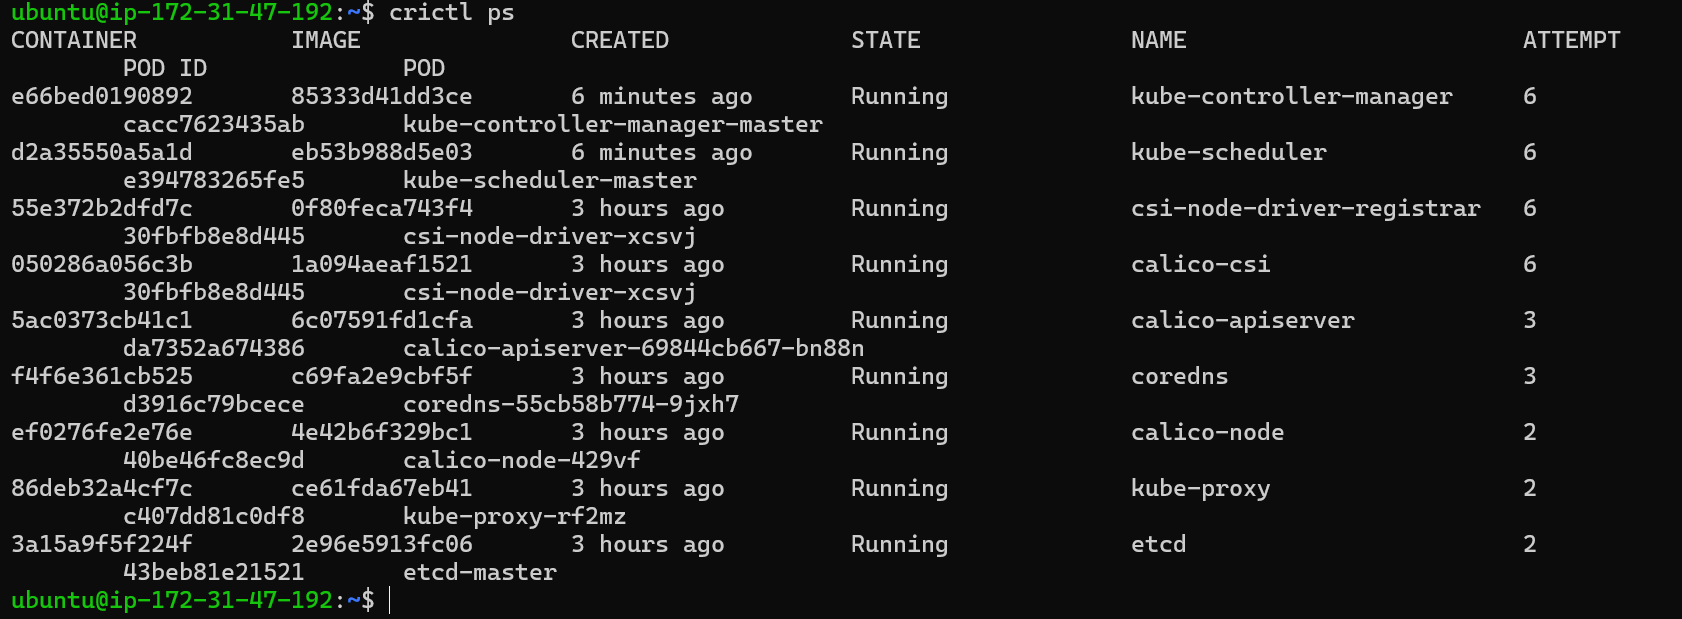
But for this image, we can see no
API-SERVERcontainer is running.Inspect Container Logs: If the API server container is not running, use
crictl ps -ato list exited containers and inspect their logs for clues about the failure.
We can see that our
kube-apiserveris exited a minute ago.
Now, we have to check manifests of kube-apiserver to find any issue in it.
Location of Manifest: The API server manifest is located in the
/etc/kubernetes/manifestsdirectory, which is the default directory for static pods.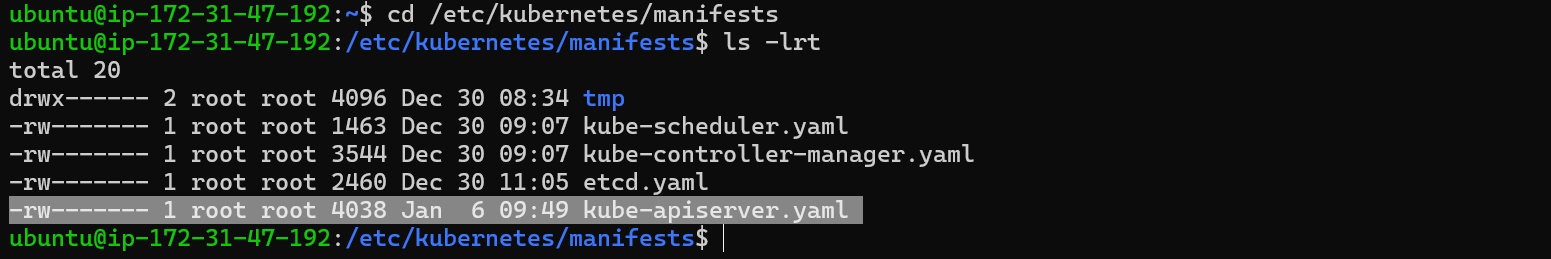
Accessing the Manifest: Use
sudo vi kube-apiserver.yamlto open the manifest file. The file is owned by the root user, so you need to usesudoto edit it.
Inspecting the Manifest: Review the manifest for any errors or configuration issues that might be causing the API server to fail.
Checking Logs: Use the
crictl logs <container_id>command to view the logs of the exited API server container. The logs might provide insights into the cause of the failure.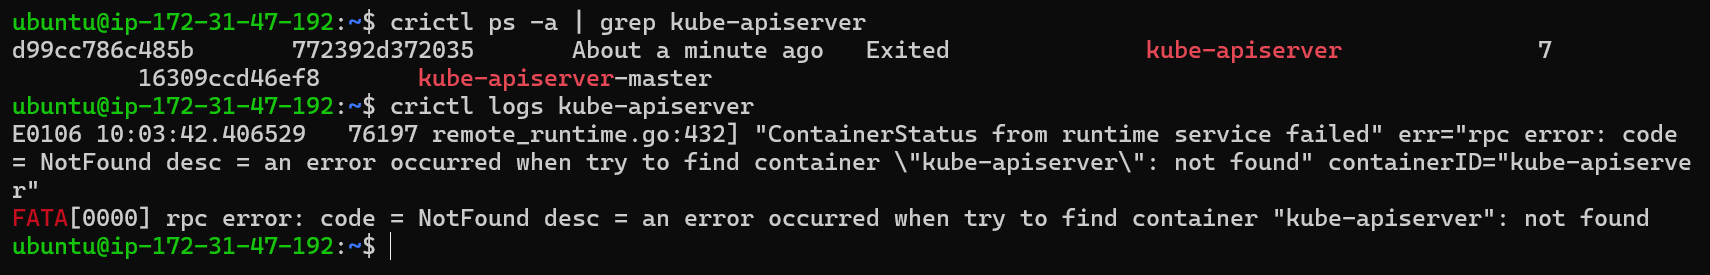
Issue: The container status shows "runtime failed" and the container ID is not found.
There is default log directory in control plane which is located at /var/log, you can check from their also.
Check Logs: Examine the default log directory (
/var/log/containers) on the control plane node.Look for Logs of API-SERVER: Verify the existence of logs for the
kube-apiserverin theContainersdirectory. If the logs are missing, it indicates the container exited and the logs were deleted.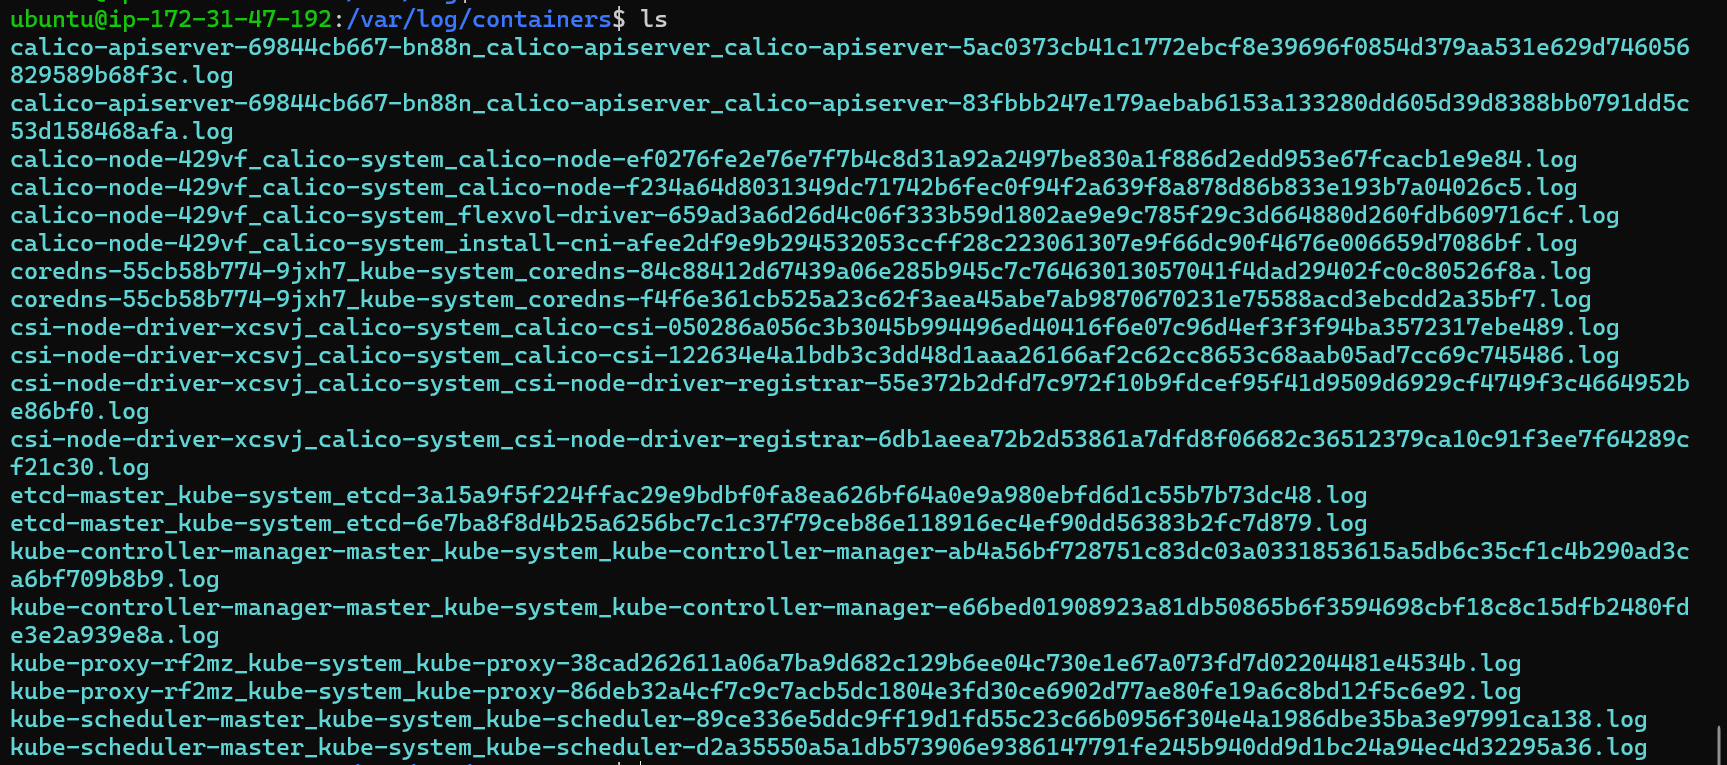
You can grep also like
ls | grep apiserverto filter the logs of apiserver.Inspect Manifest: Review the
kube-apiserver.yamlmanifest file in the/etc/kubernetes/manifestsdirectory. Ensure the content and command is correct and theadvertiseAddressmatches the node IP address where thekube-apiserveris running. Confirm that theexportPort(--secure-port) is set to6443, which is the secure port for the kube-apiserver.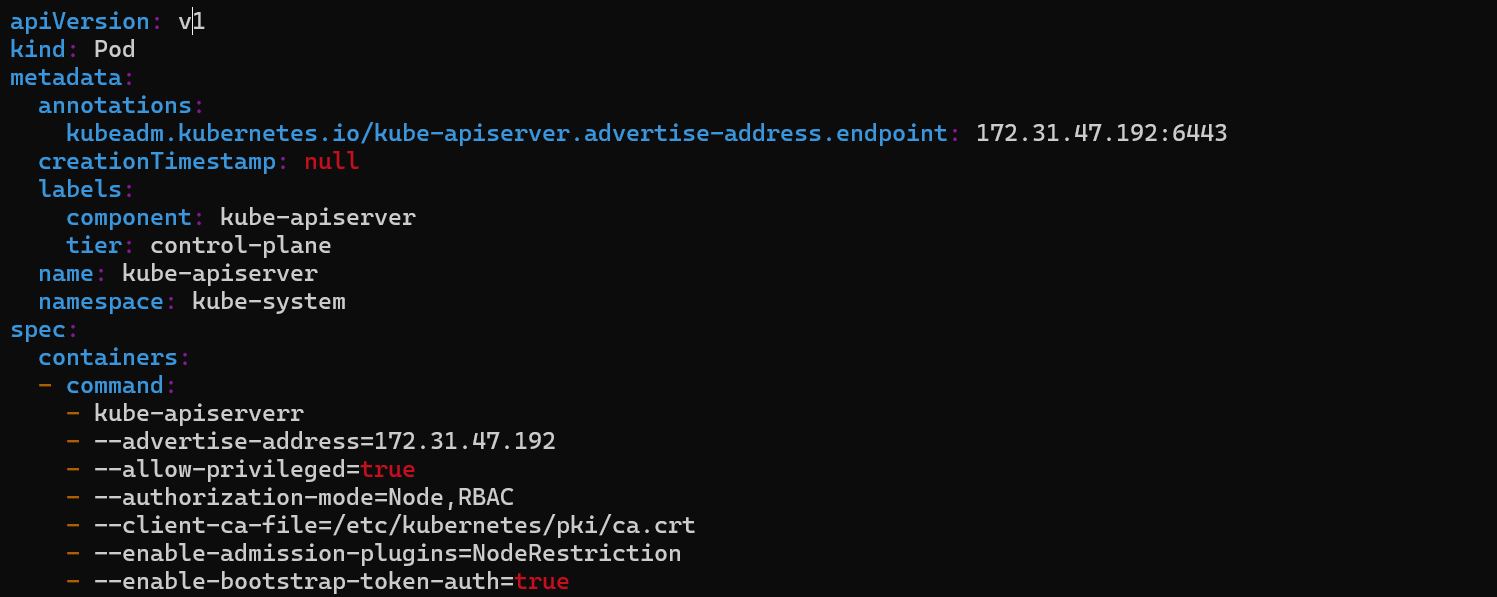
On Inspecting the file, we find that the content of
kube-apiserveris incorrect, the first command is spelled wrong with an extrarin- kube-apiserverr.Change
- kube-apiserverrto- kube-apiserverand verify other thing also.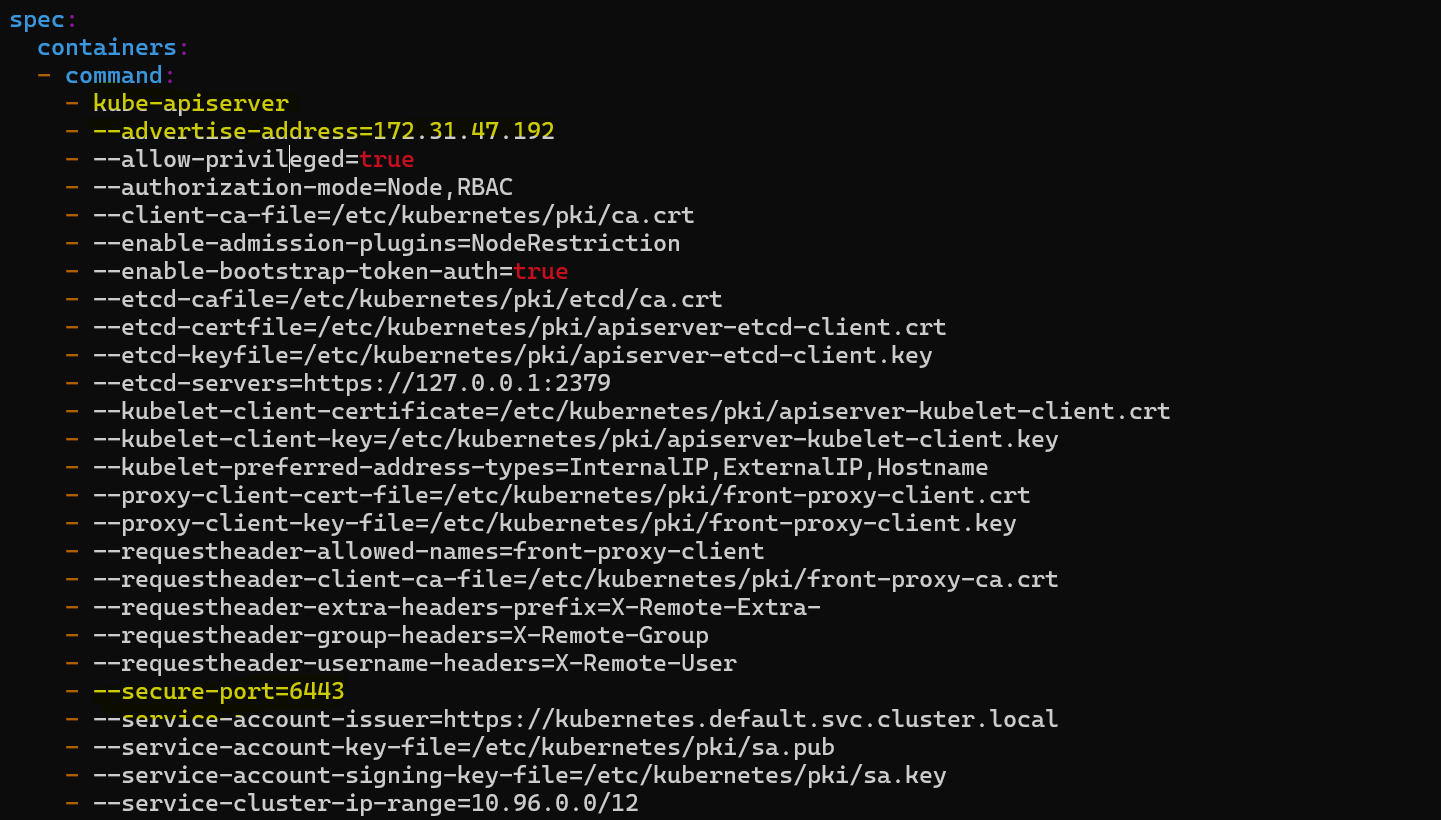
Now everything is fine so let’s save it and check if container is running or not.
Run
crictl psto check the container status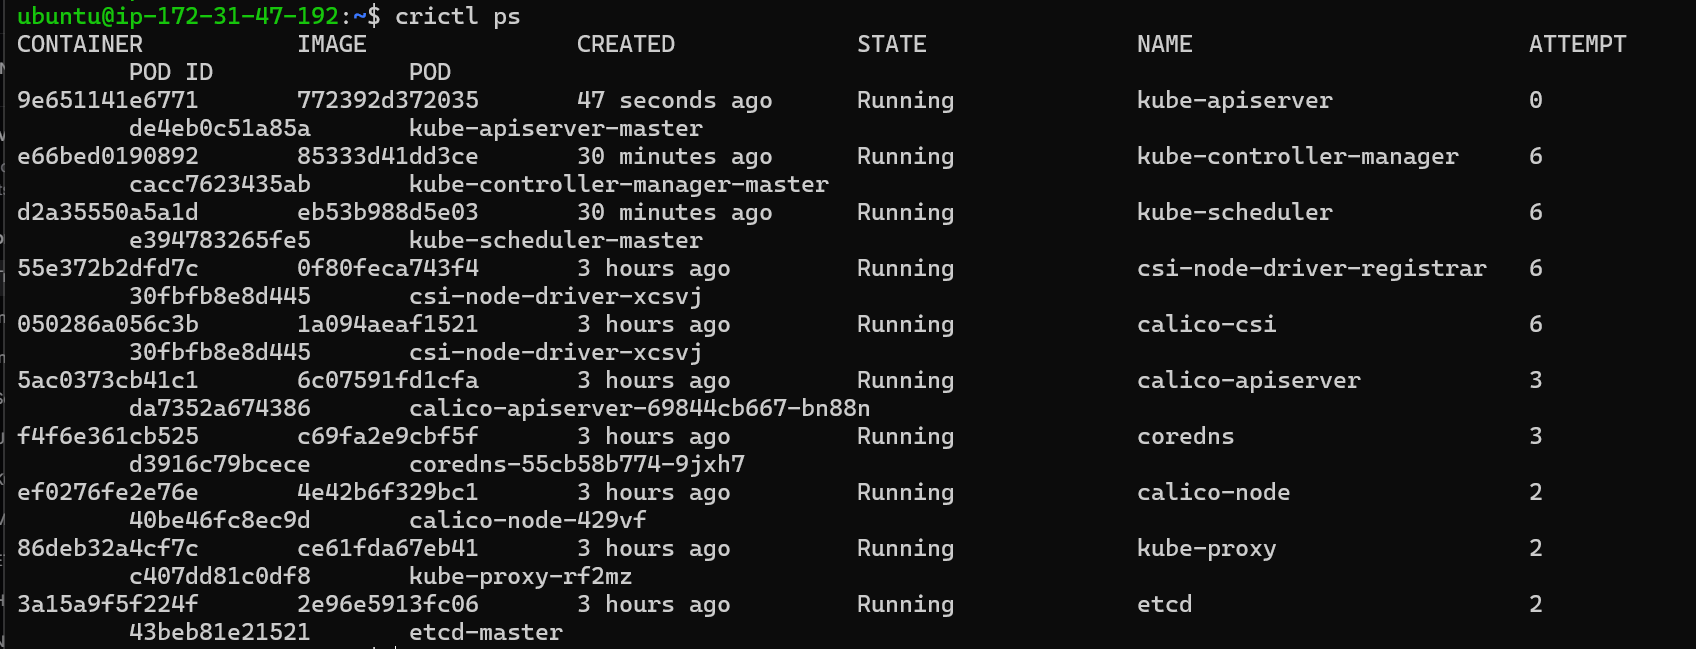
Now our
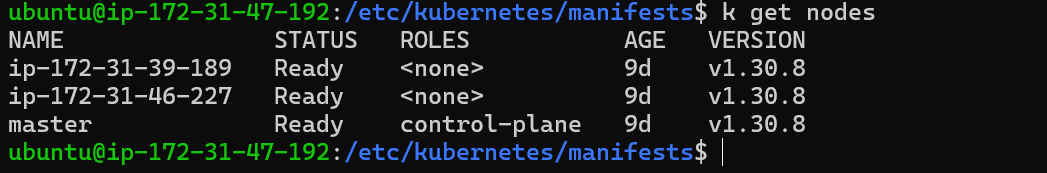
kube-apiserveris running fine, let’s check now if our nodes are healthy and running by commandkubectl get nodes.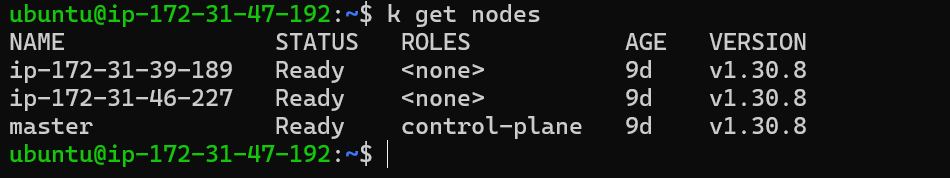
Scenario 2: Kube-Apiserver Running but kubectl Throws Errors
Issue: The kube-apiserver is running, but kubectl commands still fail.
Troubleshooting:
Verify Kubeconfig: Ensure the correct
kubeconfigfile is being used. The defaultkubeconfigfile is located in$HOME/.kube.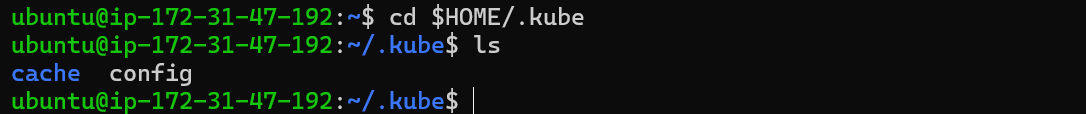
Check Environment Variable: Confirm that the `KUBECONFIG` environment variable is set correctly. Network Issues: Investigate potential network connectivity problems.
Kubeconfig File: If you are not the Kubernetes administrator, request a `kubeconfig` file from the administrator.
Default Kubeconfig: Check the default `
kubeconfig` file in the `$HOME/.kubeCheck if kube-apiserver is running or not
crictl ps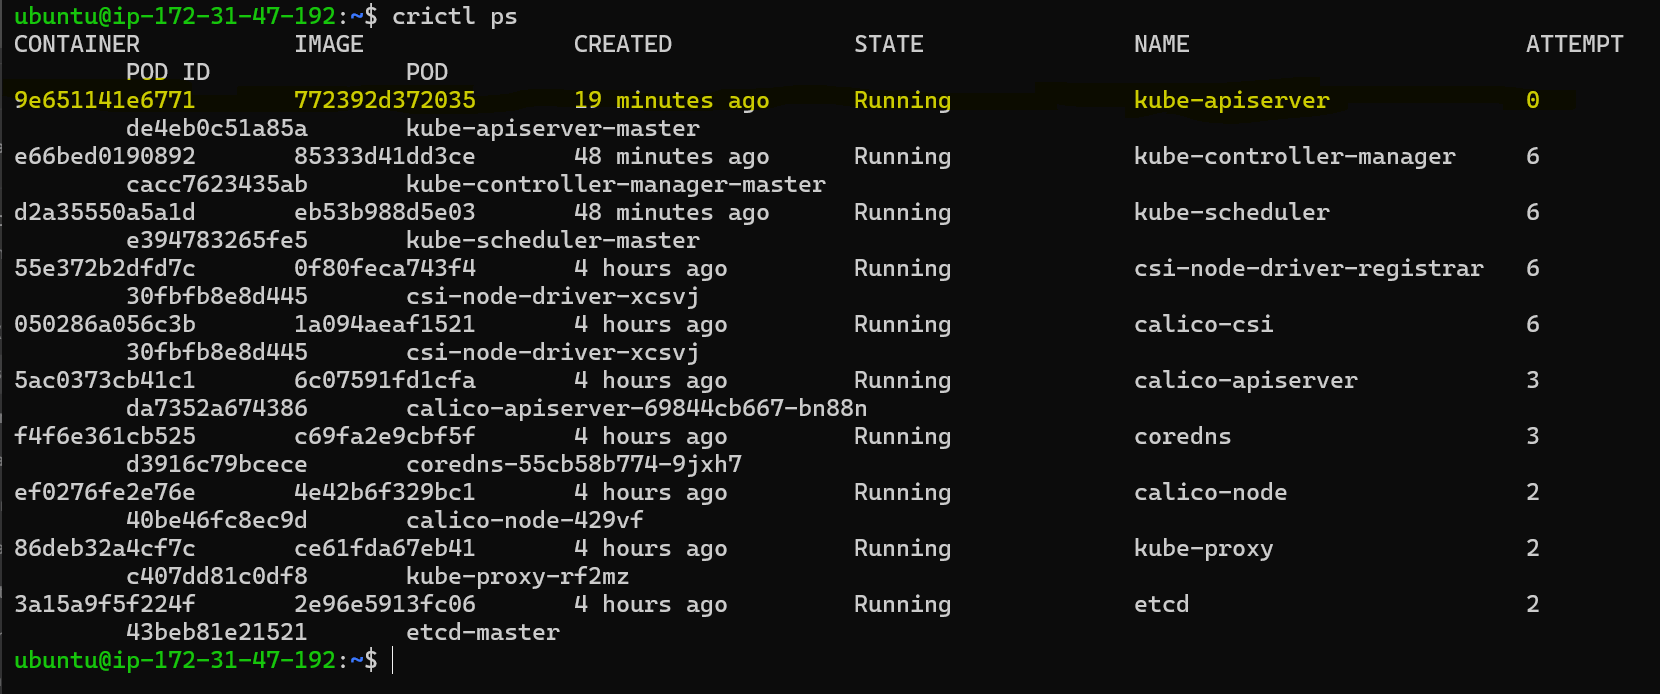
We can see that our
kube-apiserveris up and runningAdmin Kubeconfig: Examine the
admin.conffile in the/etc/kubernetesdirectory and confirm that exists or not.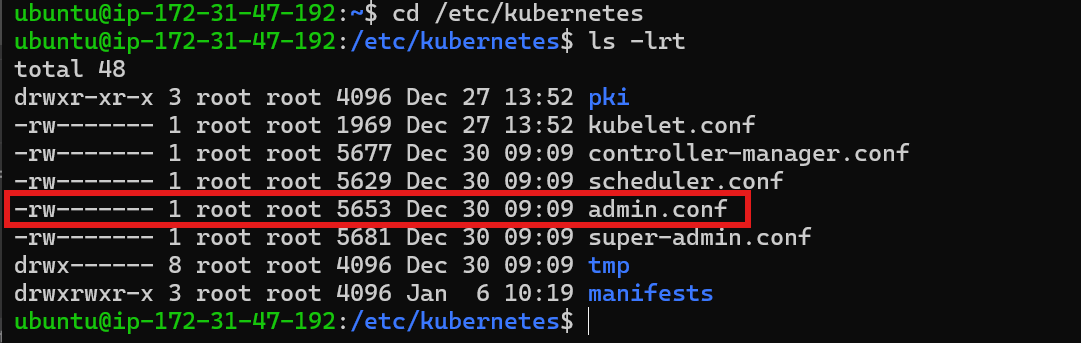
Permissions: Ensure the
admin.conffile has appropriate permissions (e.g.,775).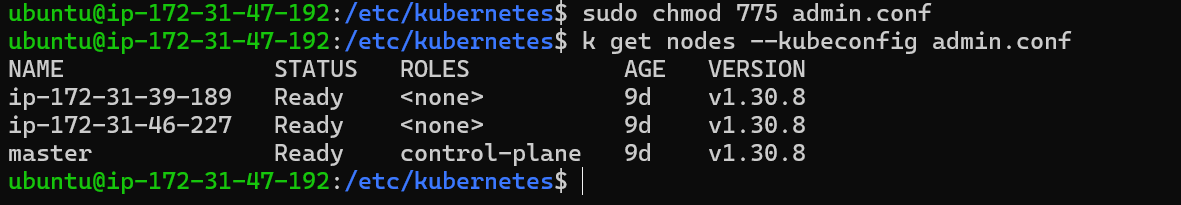
So, what you can copy this file in the default location of
kubeconfigand set the environment variables to this file and then check bykubectl get nodes.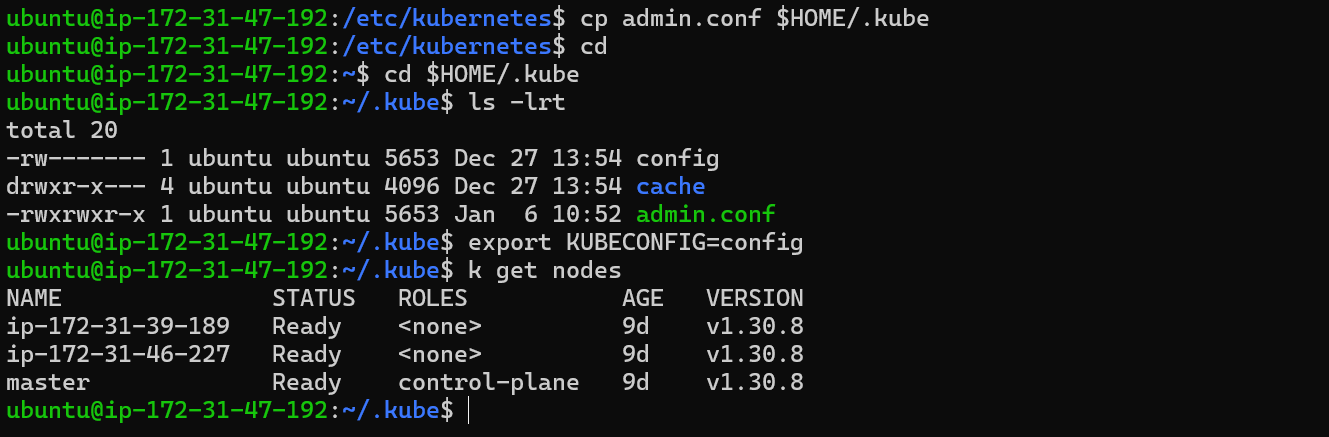
Ensure the kubectl command is using the correct configuration file. This file points to the Kubernetes API server, which is essential for interacting with the cluster.
Key Points:
The
kubectlcommand relies on a configuration file to connect to the Kubernetes API server.Verify the file path specified in the configuration file is correct. If the configuration file is incorrect,
kubectlcommands will fail to connect to the cluster.
Scenario 3: Kubernetes Pod Scheduling Troubleshooting
Issue: While scheduling the pods, it continuously remains in pending state and not scheduling.
Key Points:
The Kubernetes API server is the central control point for the cluster. It handles requests from
kubectland other tools.Ensure the API server is running and accessible.
Let’s make a pod through kubectl run nginx --image=nginx and check if it schedules or not
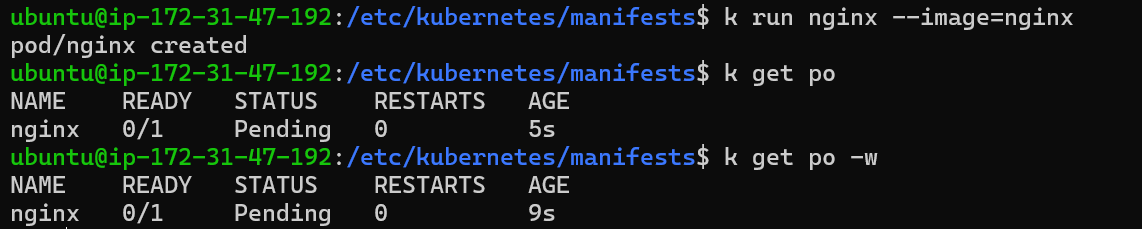
The pod is stuck in the Pending state, it indicates a scheduling issue.
Troubleshooting:
Investigating Pod Status: Use
kubectl describeto gather information about the pod's status, its events and node assignment.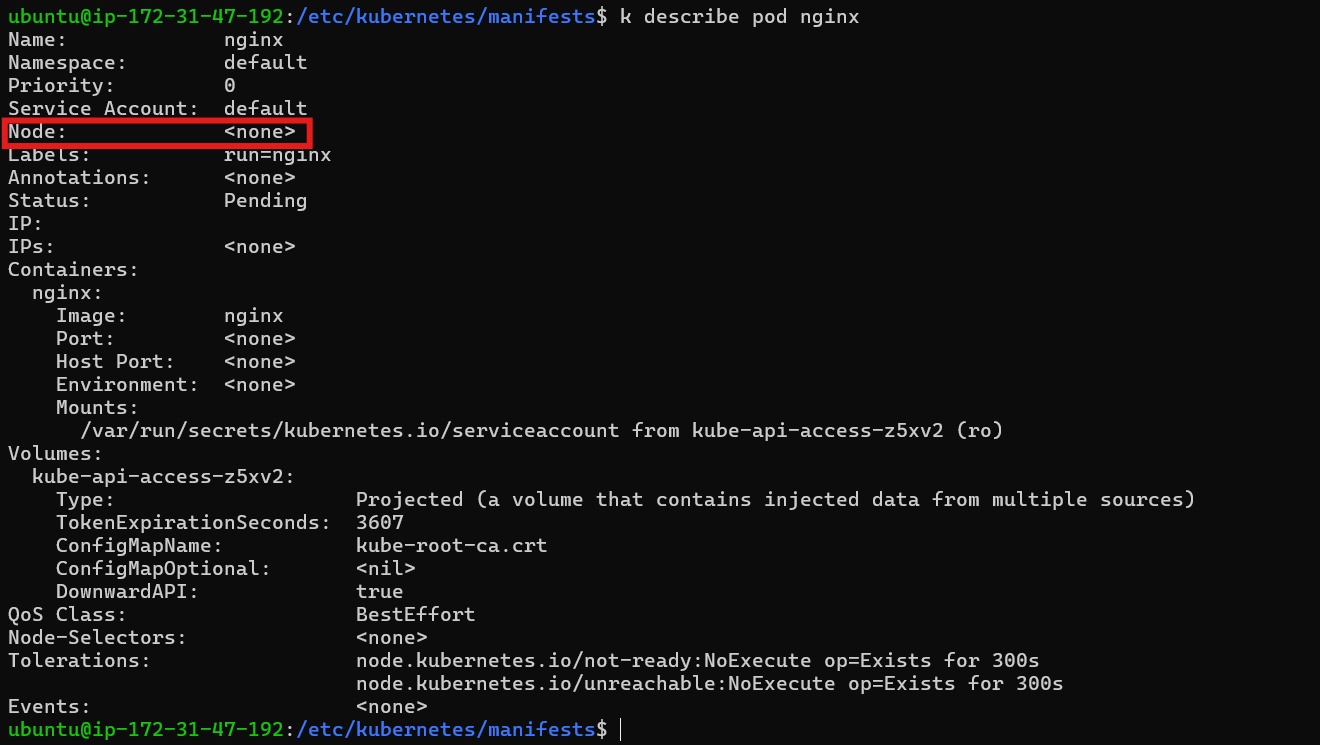
From the image we can see that the pod is not assigned to a node, it suggests a scheduling problem.
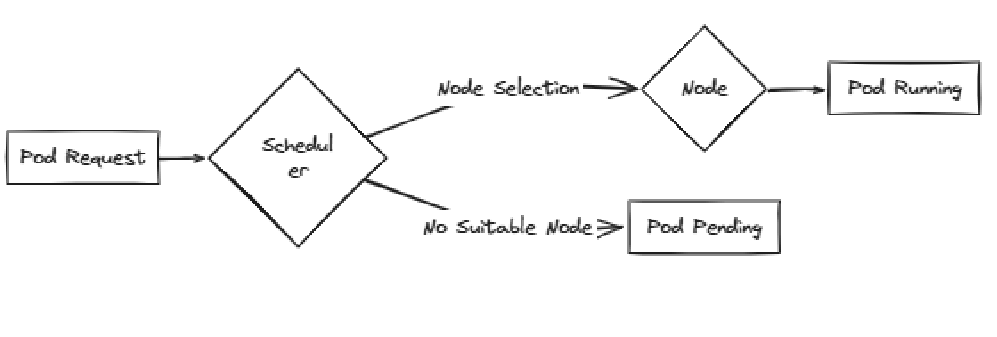
Identifying the Scheduling Component: The Kubernetes scheduler is responsible for assigning pods to nodes.
The scheduler evaluates pod requirements and node resources to determine the best fit.
If the scheduler is not functioning correctly, pods may fail to be scheduled.
Verifying Scheduler Health: Check the status of the scheduler pod using
kubectl get pods -n kube-system.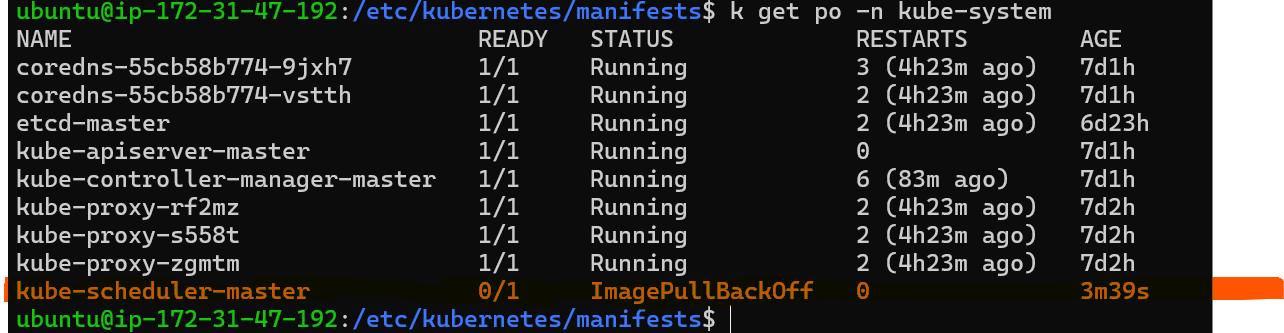
If the scheduler pod is not healthy, it may be the cause of scheduling issues.
Examine the scheduler pod's logs using
kubectl logs kube-scheduler-master -n kube-systemto identify potential problems.
Image Pull Errors: Through logs we found the scheduler pod may encounter errors pulling the image required for its operation.
Examine the scheduler pod's events using
kubectl describe pod kube-scheduler-master -n kube-systemto identify the specific error.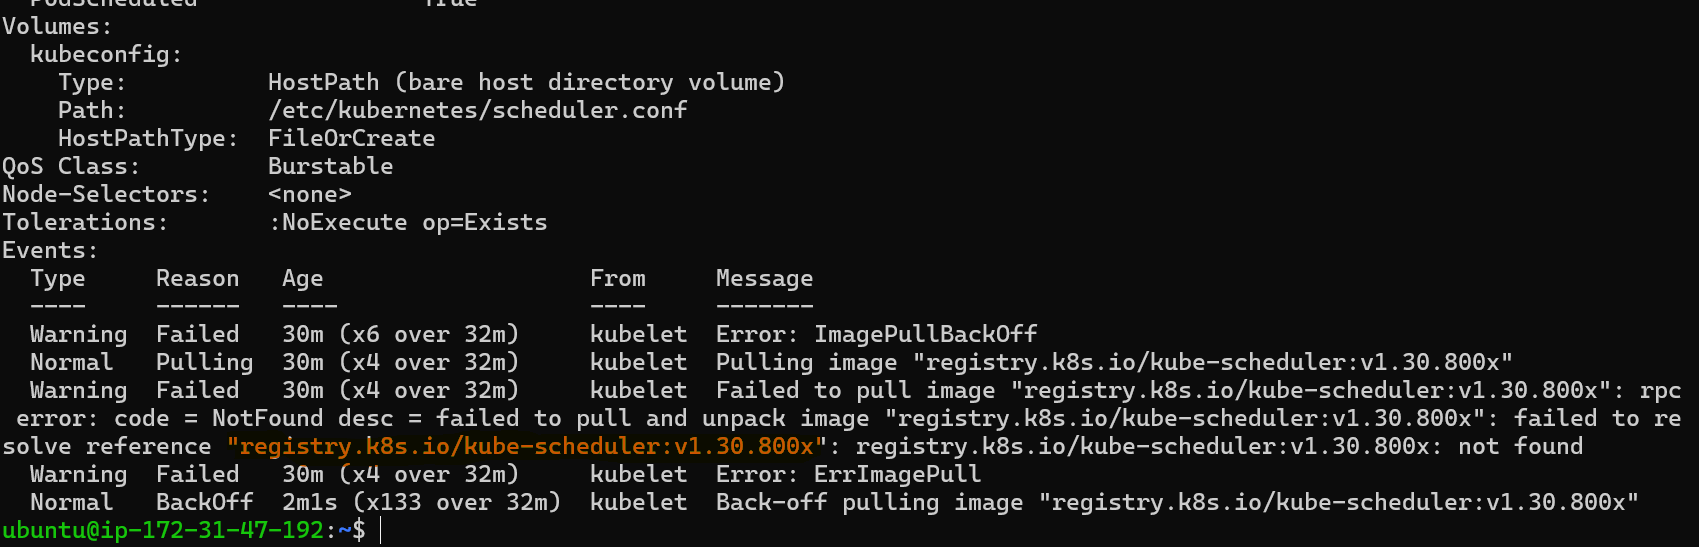
The error message may indicate an incorrect image name or tag.
Updating the Scheduler Image: Correct the image name or tag in the scheduler's manifest file.
Check the correct image tag by manifest of
kube-apiserver.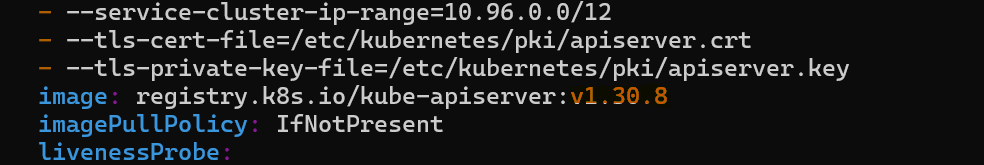
Let’s update the image tag in
kube-scheduler.yamlmanifest also by commandsudo vi kube-scheduler.yaml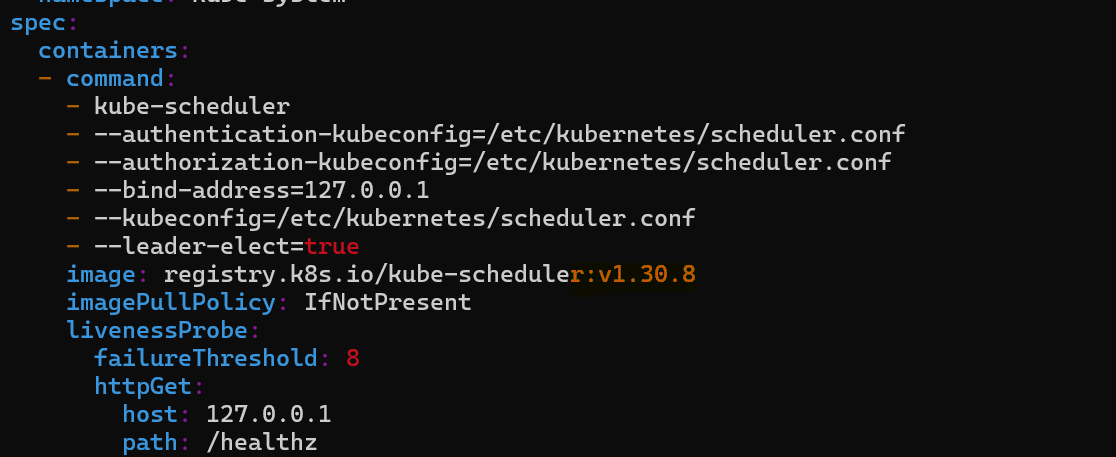
After updating the scheduler's image, it may take some time for the pod to be scheduled. Check by
kubectl get pod -n kube-system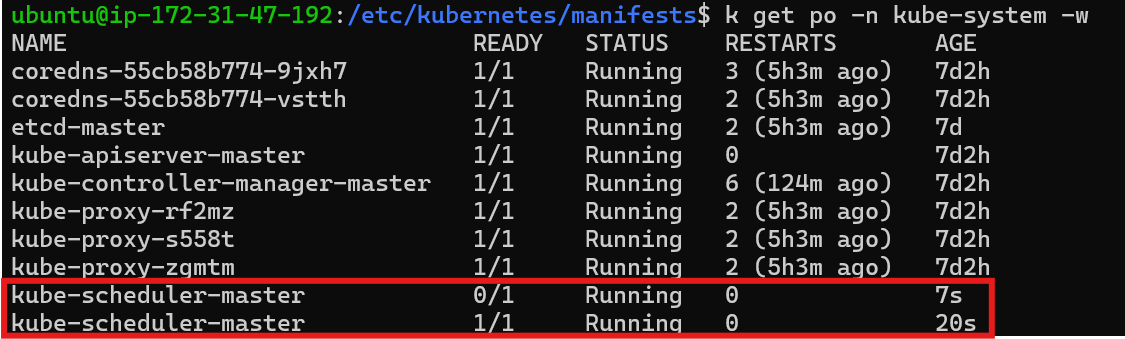
Use
kubectl get podsto monitor the pod's status. The pod should eventually transition from thePendingstate to theRunningstate.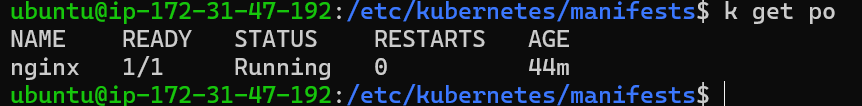
Troubleshooting Pod Scheduling
Understand the common causes of pod scheduling issues.
Key Points:
Insufficient Resources: The node may not have enough resources (CPU, memory) to accommodate the pod's requirements.
Node Affinity/Anti-affinity: Pod affinity and anti-affinity rules may prevent the pod from being scheduled on certain nodes.
Pod Disruption Budgets: Pod disruption budgets may prevent the scheduler from deleting pods, even if they are unhealthy.
Network Connectivity: Network connectivity issues between the scheduler and nodes can hinder pod scheduling.
Scenario 4: Issue with Controller Manager
Issue: Suppose we have create a deployment which creates a replicaset of 2 pods of nginx. When a pod is deleted, the scheduler will attempt to create a replacement pod.
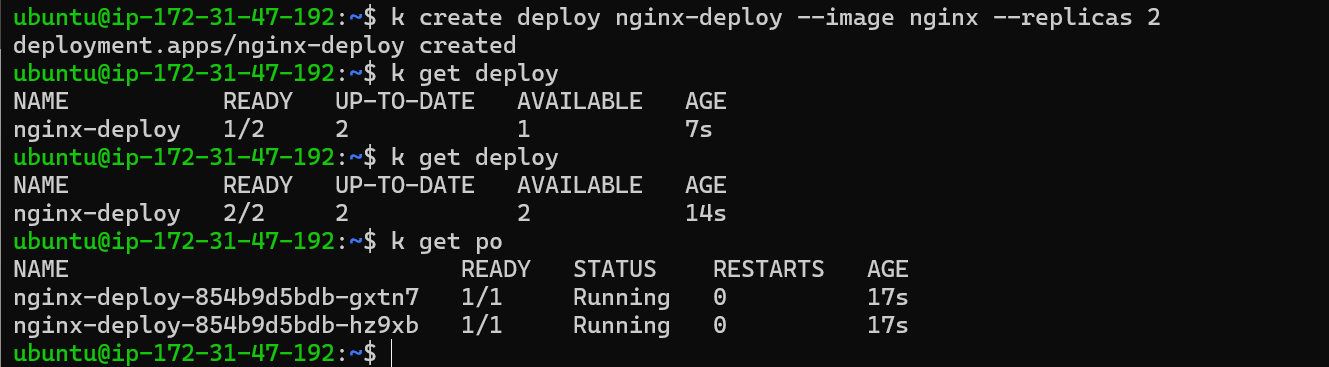
Now let’s delete a pod
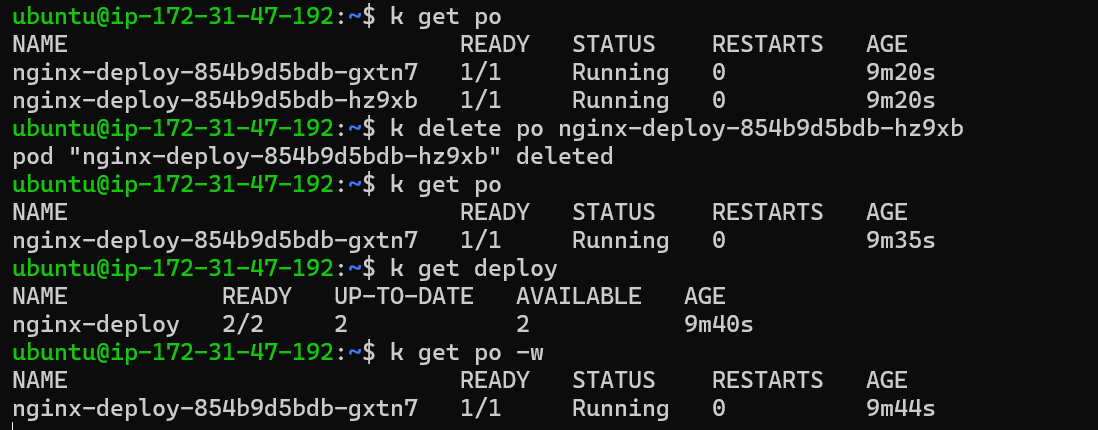
If a Pod is deleted, the Replica Set will automatically create a new Pod to maintain the desired number of replicas.
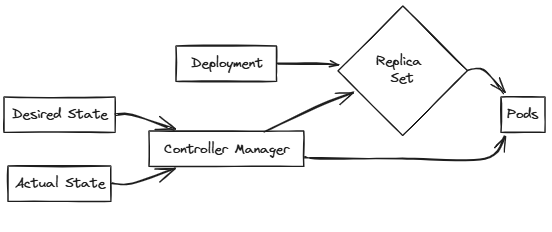
Controller Manager and Pod Creation
Controller Manager: A Kubernetes component responsible for ensuring that the desired state of the cluster matches the actual state.
Controller Manager's Role: The Controller Manager monitors the state of Pods and ensures that the desired number of replicas are running.
Troubleshooting:
Diagnosing Controller Manager Issues: The Controller Manager is not creating new Pods, indicating a potential issue with the Controller Manager itself.
Checking Controller Manager Status: The command
kubectl get pods -n kube-systemshows that the Controller Manager is in aCrashLoopBackOffState.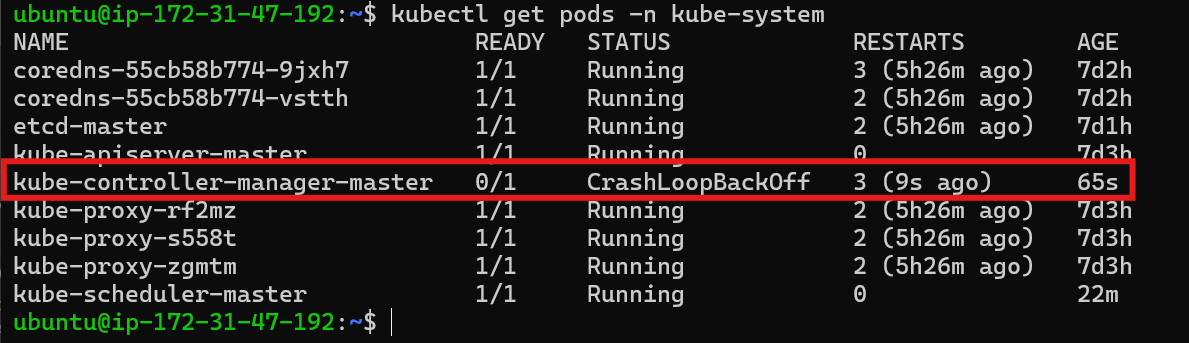
Investigating Logs: The command
kubectl logs -n kube-system <controller-manager-pod-name>shows no logs, indicating a potential issue with the Controller Manager's configuration.
Describing the Pod: The command
kubectl describe pod <controller-manager-pod-name> -n kube-systemreveals that the Controller Manager is unable to start the container process because the executable file is not found.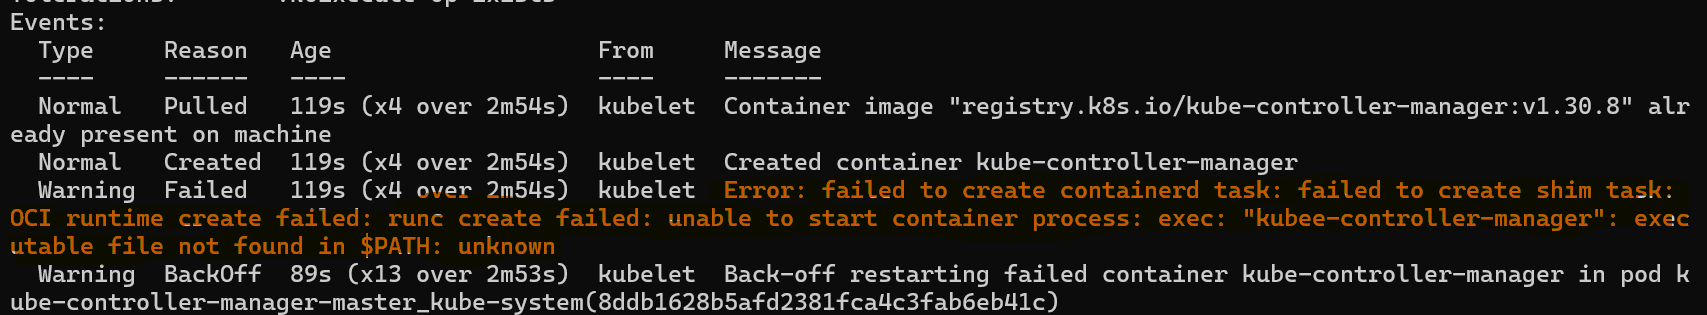
Inspect the controller-manager manifests: Go to /etc/kubernetes/manifests and open the
kube-controller-manager.yamlfile in editor mode and check for any error.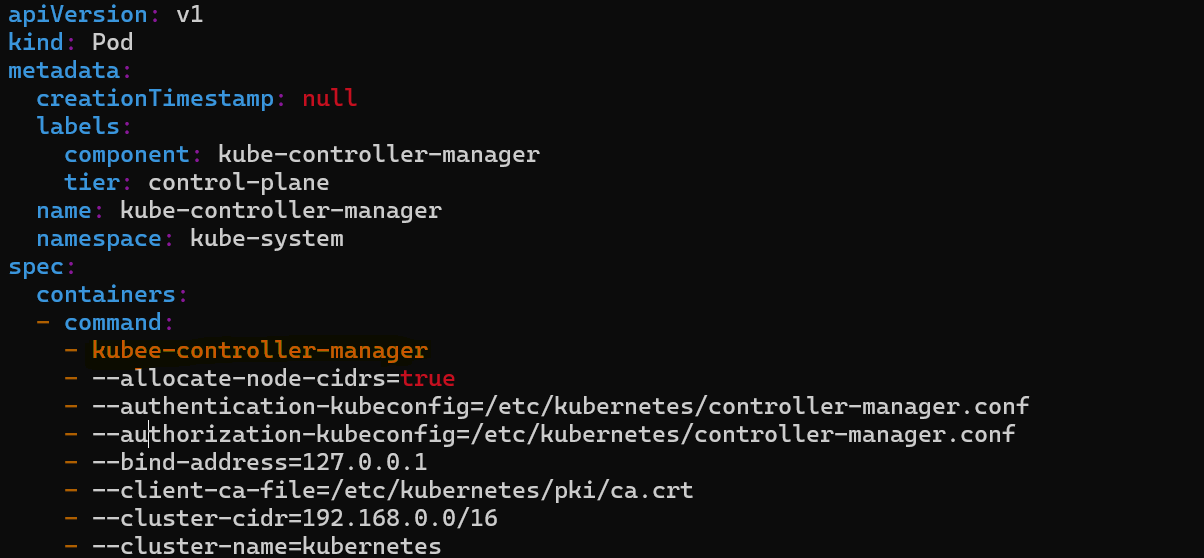
From the image we can see that
kube-controller-managercommand is spelled wrong in the file.Correcting the Command: The command in the Controller Manager's configuration file needs to be corrected.
Restarting the Controller Manager: After correcting the command, the Controller Manager should restart and start the pod in
kube-systemnamespace. Check bykubectl get pods -n kube-system.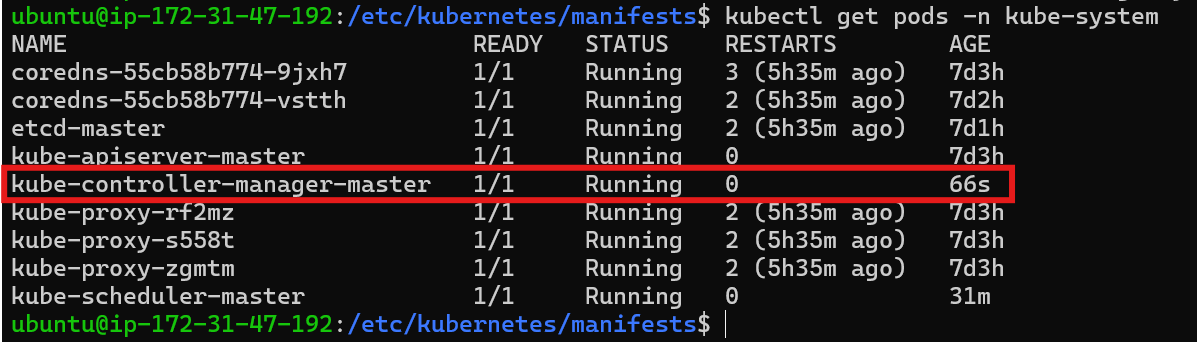
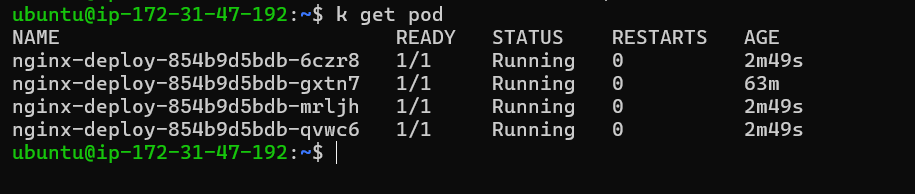
Check the nginx pod status by
kubectl get pods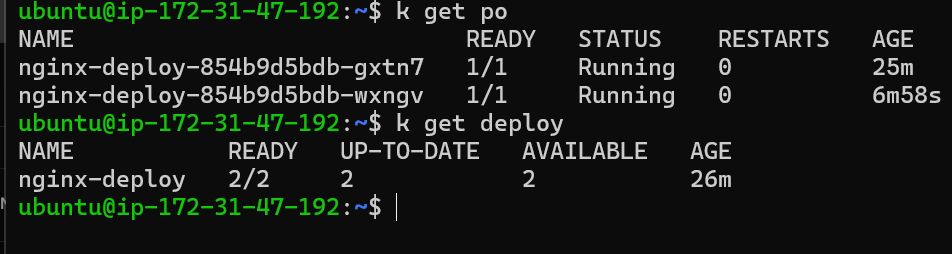
Scenario 5: Issue with Scaling the Deployment
Issue: Scaled the Nginx deployment by four replicas, but the pods are not creating.
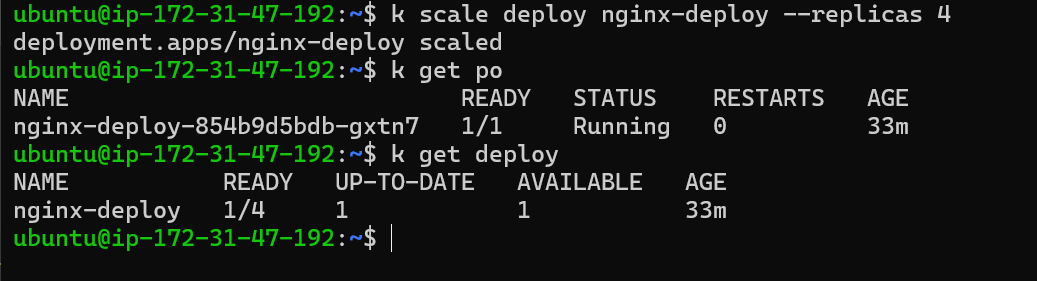
The Controller Manager is responsible for scaling the deployment by creating or deleting Pods to match the desired number of replicas. It ensures that the desired state of the cluster matches with the actual state.
Scaling Issues: The image demonstrates a scenario where the Controller Manager is unable to scale the deployment, indicating a potential issue with the Controller Manager.
Troubleshooting:
Investigating Logs: The command
kubectl logs -n kube-system <controller-manager-pod-name>shows that the command failed, indicating a potential issue with the Controller Manager's configuration.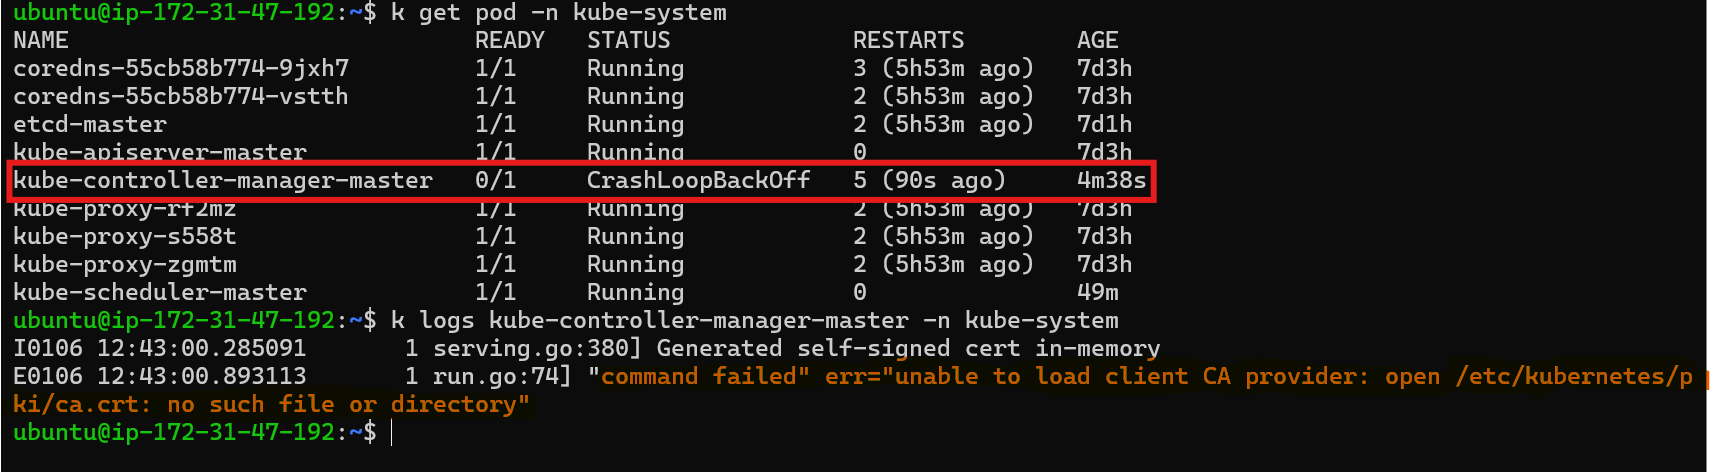
Through image we can see that there is error in ca.crt file which is being mounted in the container through volume mount.
Understanding the Role of Volumes: Volumes are used to persist data and configuration files within containers. They allow for data sharing between containers and provide a mechanism for accessing files from the host system.
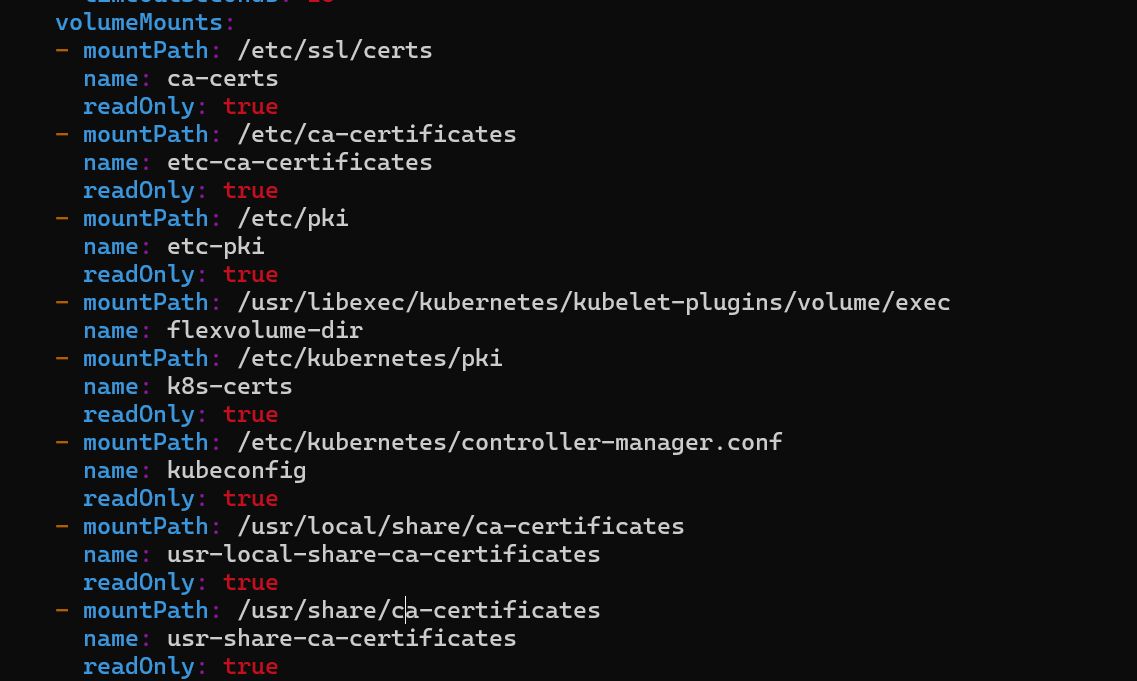
Volume Mounting: Volumes are mounted to containers using the
volumeMountssection in the pod definition. This section specifies the host path where the volume is located and the mount path within the container.Check the controller manifests: Go to
/etc/kubernetes/manifestsand checkkube-controller-manager.yamlfile.These are volumeMounts
and these are volumes
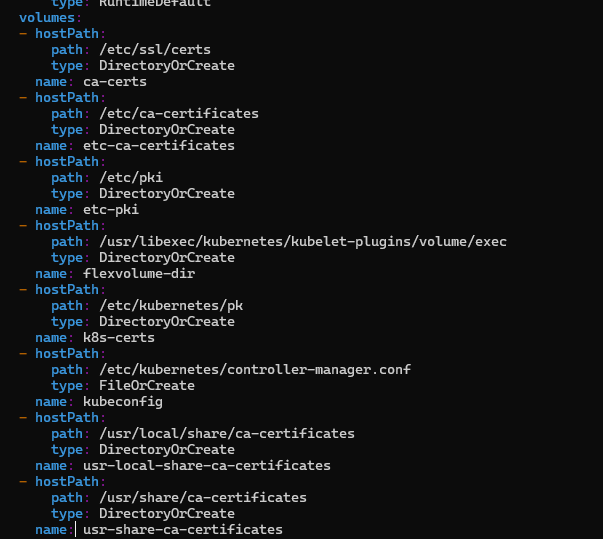
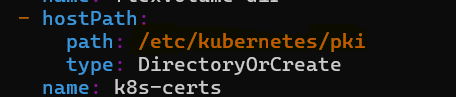
Verifying Volume Mounts: To verify if a volume is mounted correctly, check the
volumeMountssection in the pod definition and ensure the mount path and host path match.We can see
Pathof volume namek8s-credsis different in volume path and host path. The error "no such file or directory" was caused by a typo in the host path. The correct path wasetc/kubernetes/pki, but it was mistakenly written asetc/kubernetes/pk.Resolving the Issue: After correcting the typo in the host path, the pod was restarted, and the error was resolved.
Monitoring Logs: Use the
kubectl logscommand to monitor the container logs and identify any errors or warnings.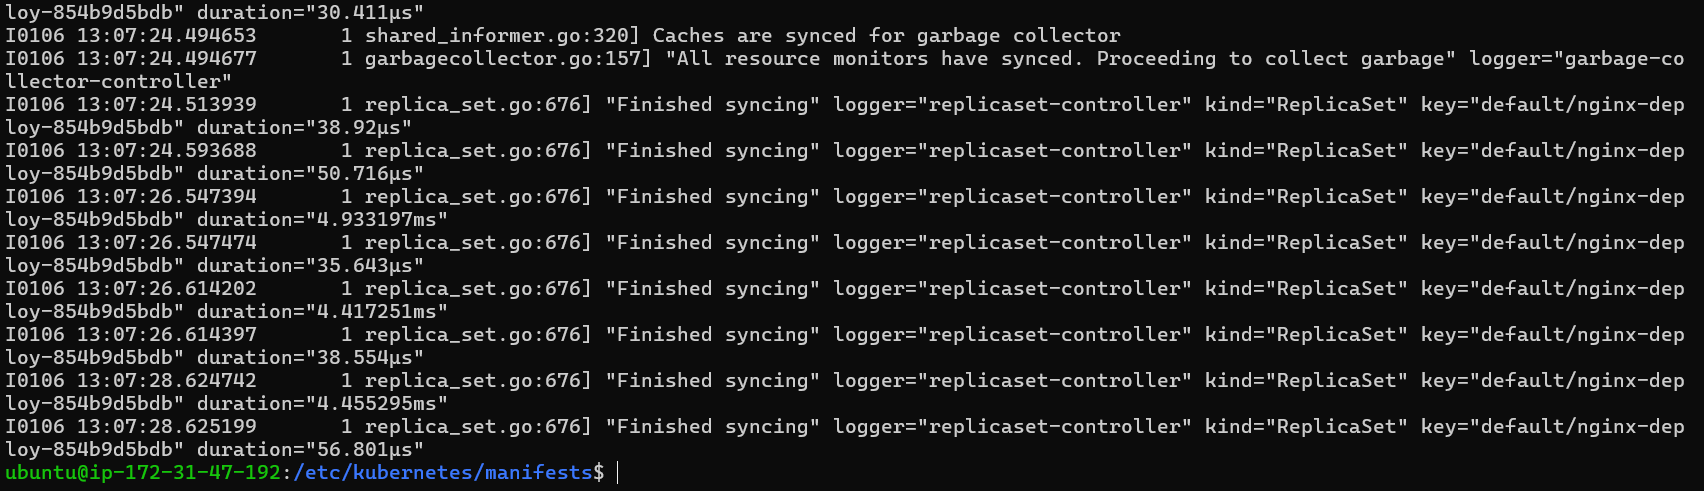
Checks the pods
Kubernetes Cluster Information and Debugging
Cluster Information:
The kubectl cluster-info command provides information about the Kubernetes control plane, including the API server address, DNS server address, and other relevant details.

Detailed Cluster Information:
The kubectl cluster-info dump command provides a more detailed dump of the cluster information, including logs and configuration details.
Read the Kubernetes Documents also


